

Gender disparities in participation and completion vary by country group and education level
Credit: Joseph Muhumuza Photography
Gender disparities in participation and completion vary by country group and education level
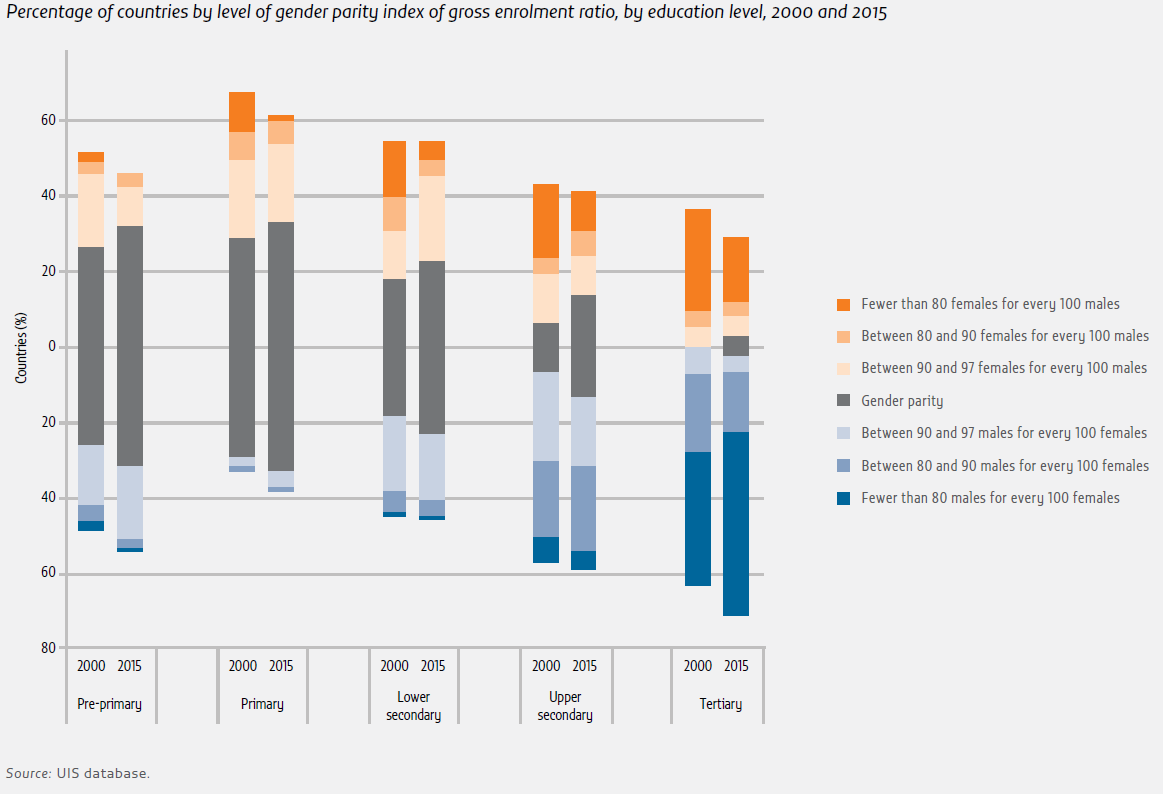
The world, taken as a whole, has achieved the target of gender parity at all levels except tertiary education. But this is not true of all regions, country income groups or individual countries. Only 66% of countries have achieved gender parity in primary education, 45% in lower secondary and 25% in upper secondary (Table 3).

Between 2000 and 2015, the share of countries that achieved gender parity in primary education increased by 8 percentage points and in upper secondary education by 14 percentage points (Figure 1). In 2015, the share of countries with fewer than 80 females enrolled for every 100 males was 1% in primary education (Afghanistan and South Sudan), 5% in lower secondary and 10% in upper secondary.
The world is still a long way from ensuring that all children, adolescents and youth, of either gender, are enrolled in school. In 2015, there were 264 million primary and secondary age children and youth out of school. This includes some 61 million children of primary school age (about 6 to 11 years; 9% of the age group), 62 million adolescents of lower secondary school age (about 12 to 14 years; 16% of the age group) and 141 million youth of upper secondary school age (about 15 to 17 years; 37% of the age group). After a decline in the early 2000s, out-of-school rates have stagnated (since 2008 for primary education, 2012 for lower secondary and 2013 for upper secondary).
Gender disparities in out-of-school rates have narrowed substantially over the last 15 years. Globally, a gap exists only in primary education: 9.7% of primary school-age girls and 8.1% of boys are out of school, or 5 million more girls than boys. In lower and upper secondary education, there is parity overall, but disparities emerge at regional level. For example, in Northern Africa and Western Asia, 12% of adolescent boys and 18% of adolescent girls are out of school. In Eastern and South-eastern Asia, 25% of young men and 19% of young women are out of school.
Overall, the percentage of countries at parity according to the adjusted net enrolment rate, which is the indicator underpinning the number of out-of-school children, adolescents and youth, is at least ten percentage points higher than the parity index for the gross enrolment ratio. For example, while only 66% of countries are at parity in terms of the primary gross enrolment ratio, 77% of countries are at parity in terms of the adjusted net enrolment rate (Figure 2a).


Disaggregating the distribution of the gender parity index values by country income group also shows that at the upper secondary level, among countries that have not achieved parity, disparity is overwhelmingly at the expense of girls in low income countries but at the expense of boys in upper middle and high income countries (Figure 2c).
Enrolment does not guarantee completion. Based on household survey data in 2010–2015, completion rates were 83% for primary, 69% for lower secondary and 45% for upper secondary education. As with the enrolment indicators, globally, gender parity has been achieved in completion rates at the three education levels. But this masks disparities between regions and country income groups. For example, 86 females completed the lower secondary education level for every 100 males in sub-Saharan Africa, while in Latin America and the Caribbean, 93 males completed the level for every 100 females. Likewise, 66 females completed the upper secondary education level for every 100 males in low income countries, while in upper middle and high income countries 94 males completed for every 100 females (Table 4).

Disparities in completion rates among poorer children, adolescents and youth also vary. In Eastern and Southeastern Asia and in Latin America and the Caribbean, more poor females than poor males completed lower and upper secondary education. However, in Southern Asia and sub-Saharan Africa, more poor males than poor females completed lower and upper secondary education. In low income countries, just 2% of the poorest females and 3% of the poorest males completed upper secondary education.
On some indicators, the parity index can be a misleading measure. As the 2016 Global Education Monitoring Report showed, the value of the index will be close to parity in countries that are close to universal completion. It is, therefore, important to compare countries that are at roughly similar levels on the underlying indicator. For example, Nigeria and Tunisia have similar completion rates overall, but 75 females completed upper secondary for every 100 males in Nigeria, while 75 males completed for every 100 females in Tunisia (Figure 3).

In tertiary education, only 4% of countries have achieved parity, with the gender imbalance increasingly at the expense of males: Overall, there are more females than males in tertiary education in almost all regions. As Southern Asia moves towards closing the gap, sub-Saharan Africa is the only region where women still do not enrol in or graduate from tertiary education at the same rates as men. However, in many countries, although women outnumber men as graduates, they lag behind men in completing science, technology, engineering and mathematics (STEM) degrees. In Chile, Ghana and Switzerland, women account for less than one-quarter of all STEM degrees. By contrast, women in Albania, Algeria and Tunisia are more likely than men to earn a STEM degree (Figure 4).

For adult education and training participation rates, labour force surveys remain the data source with the highest potential for monitoring, although data are available only for a limited number of countries. In Europe, the EU Labour Force Survey (LFS), carried out quarterly since 1983 in 33 countries, is the official source of information on adult education, which is defined to include ‘all learning activities undertaken … with the aim of improving knowledge, skills and competences, within personal, civic, social or employment-related perspectives’ (Eurostat, 2017b). It covers participation in both formal and non-formal education and training during the four weeks prior to the interview.


Analysis of the 2007–2016 data suggests notable gender differences. Women are more likely to participate in education and training in all population groups defined by age and labour force status except those who do not actively participate in the labour force (Figure 5.a). There is considerable inequality in participation by age. In 2016, 17% of 25- to 34-year-olds participated in education and training, compared to 6% of 55- to 64-year-olds (Figure 5.b).
